Click to Open Rates: A Guide for the Post-MPP Era
Understand click to open rates in a post-MPP world. Learn why this metric is crucial, how to calculate it, and how to improve it for better email engagement.

On this page
Most advice about click to open rates is stuck in an older version of email marketing. It tells you to compare your campaigns to broad benchmark ranges, chase higher opens, and treat CTOR like a universal scorecard. That worked better when an open was a closer proxy for human attention.
It doesn’t work as cleanly now.
Apple’s Mail Privacy Protection changed the meaning of the open itself. When the denominator gets distorted, every benchmark built on that denominator gets shakier. That doesn’t make CTOR useless. It makes it more specific. Click to open rates are no longer a vanity benchmark. They’re an internal diagnostic tool. They help you judge whether people who appear interested enough to open your email found the message compelling enough to click.
For founders, that distinction matters. If opens rise while clicks stall, your subject line may be doing its job while the body copy, offer, CTA, or inbox placement falls short. If you want a broader framework for thinking beyond one top-line number, Otter A/B’s piece on why secondary metrics matter is worth reading. In practice, CTOR sits in that exact category. It’s not the only metric that matters, but it often tells you what the headline metric is hiding.
A good analytics view helps because the insight usually comes from patterns, not one campaign. That’s why a proper email analytics dashboard matters more than a single report export.
Why Your Open Rate Is No Longer the Whole Story
Open rate used to be the first number everyone checked. It still gets attention because it’s easy to understand and easy to celebrate. The problem is that it no longer tells a clean story on its own.
Apple’s Mail Privacy Protection inflated the meaning of opens by making the “open” denominator less trustworthy. That’s why many teams now treat open rate as directional at best, not definitive. An open can still suggest reach, inbox visibility, or subject-line appeal. It just can’t reliably prove that a person actively engaged with the message.
What open rate still tells you
Open rate isn’t dead. It’s just limited.
It can still help you compare subject lines, from names, and timing in a rough way. But once you’re trying to understand whether the email itself persuaded someone to act, open rate falls apart fast. You need a metric that starts after the subject line has already done its job.
That’s where CTOR becomes useful. It isolates what happened among people counted as openers and asks a more practical question: did the content make them click?
Practical rule: Treat opens as a visibility signal. Treat clicks as an action signal. Treat click to open rates as the bridge between the two.
Why founders should care
If you run email for a DTC brand or SaaS product, this changes how you diagnose problems. A campaign with strong opens and weak CTOR usually points to one of a few issues:
- Weak message match: The subject line promised one thing, but the email body delivered something else.
- Poor CTA clarity: Readers saw the offer but didn’t know what to do next.
- Friction in design: The link placement, layout, or mobile rendering got in the way.
- Inbox quality issues: Some opens may not represent active readers in the first place.
That’s why open rate is no longer the whole story. It tells you that the door may have opened. CTOR tells you whether anyone stepped inside and moved toward action.
What Is Click-to-Open Rate
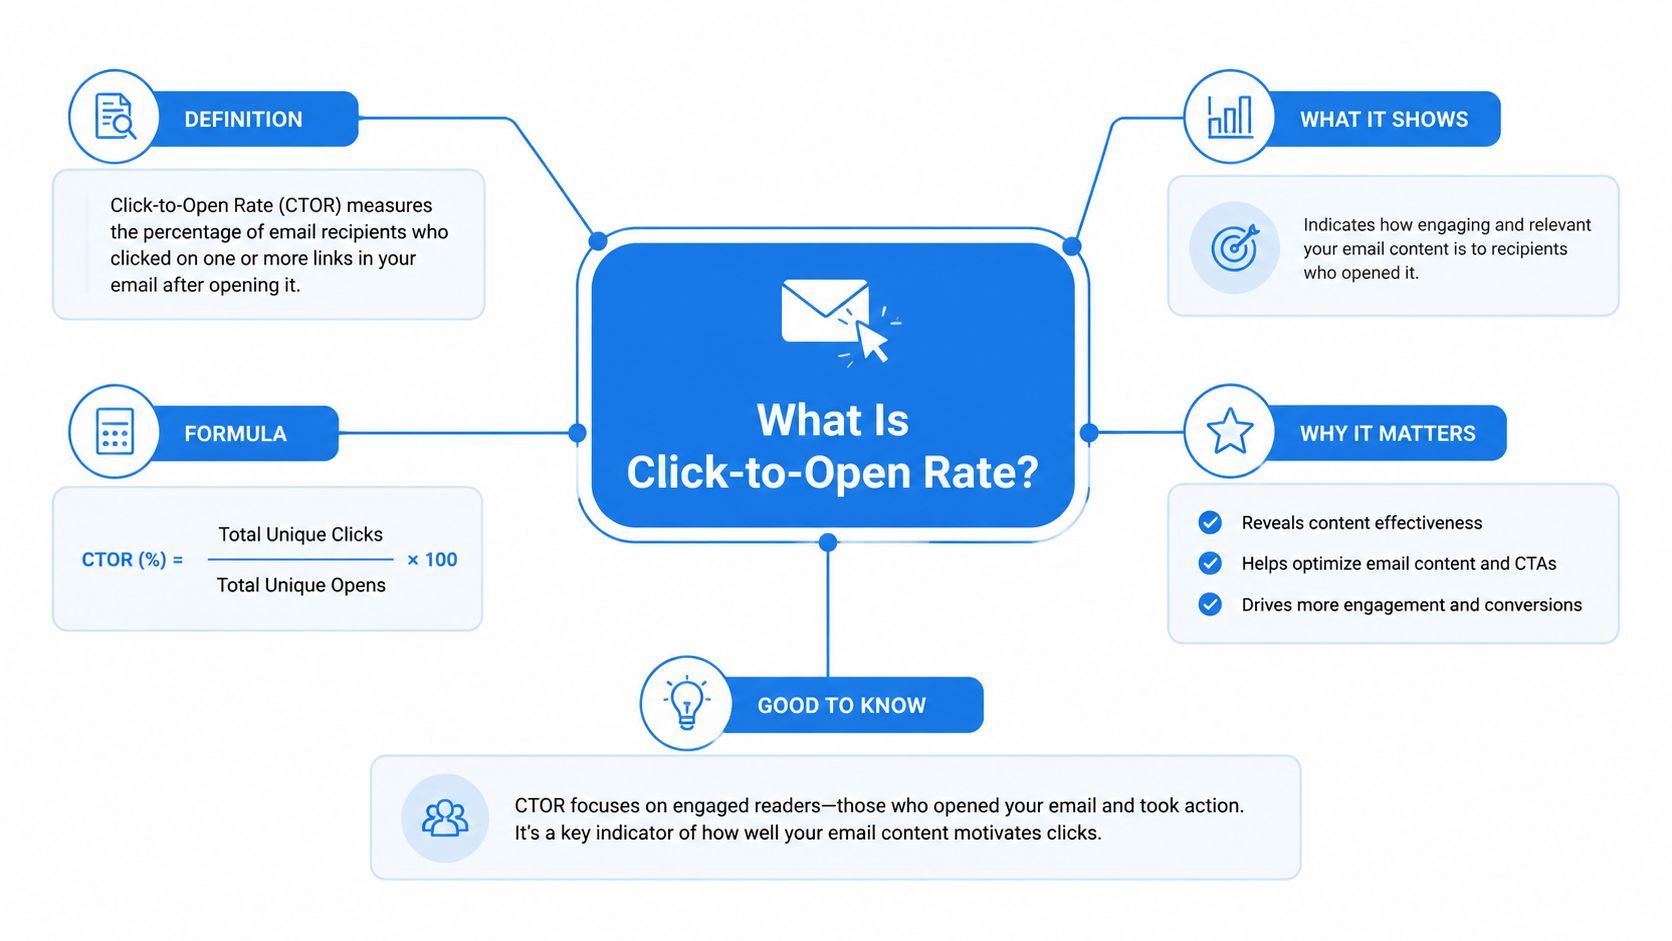
Click-to-open rate, usually shortened to CTOR, measures how many people clicked after opening your email. It focuses on engagement with the message itself, not just whether the email registered as opened.
The simplest way to think about it is this: open rate is someone entering the store. CTOR is whether they picked up a product and looked closer. Plenty of people walk in. Fewer take the next step.
The formula
The calculation is straightforward. Divide unique clicks by unique opens, then multiply by 100. Email List Verify gives a simple example in its guide to click-to-open rate calculation: if 1,000 people open your email and 200 click a link, your CTOR is 20%.
Written as a formula:
| Formula | Meaning |
|---|---|
| (Unique Clicks / Unique Opens) × 100 | The share of openers who clicked |
That structure matters because it separates interest in the subject line from interest in the message.
What CTOR actually measures
CTOR is best used to evaluate the part of the campaign readers saw after the open. That usually includes:
- Email copy
- Offer relevance
- CTA strength
- Design clarity
- Message sequencing
If your subject line gets attention but the body doesn’t convert attention into action, CTOR exposes the gap. That’s why experienced email marketers often use click to open rates to judge creative quality, not just campaign performance.
A low CTOR usually means the email got attention but failed to create momentum.
A worked example
Say you send a product launch email.
- Delivered emails: tracked separately in your platform
- Unique opens: 1,000
- Unique clicks: 200
Your CTOR is 20%.
Now imagine a different campaign with the same click total but more opens. The CTOR changes because the quality of engagement among openers changes. That’s the point. CTOR asks whether your email convinced the people who got far enough to see it.
When this metric is most useful
CTOR becomes especially helpful when you’re comparing:
- Two email layouts with the same audience
- Two offers sent to similarly engaged segments
- Broadcasts versus automations
- Different CTA approaches inside the same campaign type
Used that way, CTOR stops being abstract. It becomes a sharp tool for figuring out whether the email itself did its job.
CTOR vs CTR and Other Key Email Metrics
Email dashboards usually pile several metrics next to each other, which makes it easy to treat them as interchangeable. They aren’t. Each one answers a different question.
CTOR asks whether the email content persuaded people who opened. CTR asks how many delivered emails generated clicks. Open rate asks how many delivered emails registered as opened. Conversion rate asks whether clicks turned into business outcomes.
If you want a broader refresher on the full set of metrics that belong on your dashboard, Clepher’s guide to 8 essential email marketing KPIs is a useful companion.
The key distinction
The most important split is CTOR versus CTR.
CTR uses delivered emails as the denominator. CTOR uses opens. That means CTR blends several variables together: deliverability, subject line effectiveness, and email-body performance. CTOR narrows the frame and looks at what happened after the open.
That makes CTOR more useful when you want to judge the quality of the message itself.
Email engagement metrics compared
| Metric | Formula | What It Measures | Primary Use Case |
|---|---|---|---|
| Open Rate | Opens / Delivered | Whether emails registered as opened | Subject line and sender-name testing, with caution |
| CTR | Clicks / Delivered | Total click activity relative to sends | Overall campaign efficiency |
| CTOR | Clicks / Opens | How well the email content converted openers into clickers | Diagnosing content, CTA, and relevance |
| Conversion Rate | Conversions / Clicks or Delivered, depending on setup | Business outcome after the click | Revenue and funnel performance |
When CTOR is the better lens
Use CTOR when the campaign already earned attention and you want to know whether the body closed the gap between interest and action.
That usually applies to:
- Promotional emails where offer framing matters
- Product announcements where the CTA must be obvious
- Lifecycle messages where relevance should be high
- Newsletter content where editorial structure affects clicks
When CTOR can mislead
CTOR is not a replacement for everything else.
If inbox placement is weak, CTOR can look decent while revenue stays flat because too few people saw the email in the first place. If landing pages underperform, CTOR can also look healthy while conversion rate disappoints. Good operators read CTOR in context, not isolation.
A strong CTOR tells you the email persuaded readers. It doesn’t guarantee the rest of the funnel worked.
That’s why the best reporting stacks pair CTOR with click rate, conversion rate, and reply trends. Each metric covers a different failure point.
What Is a Good Click-to-Open Rate in 2026
The standard answer is simple. The useful answer is not.
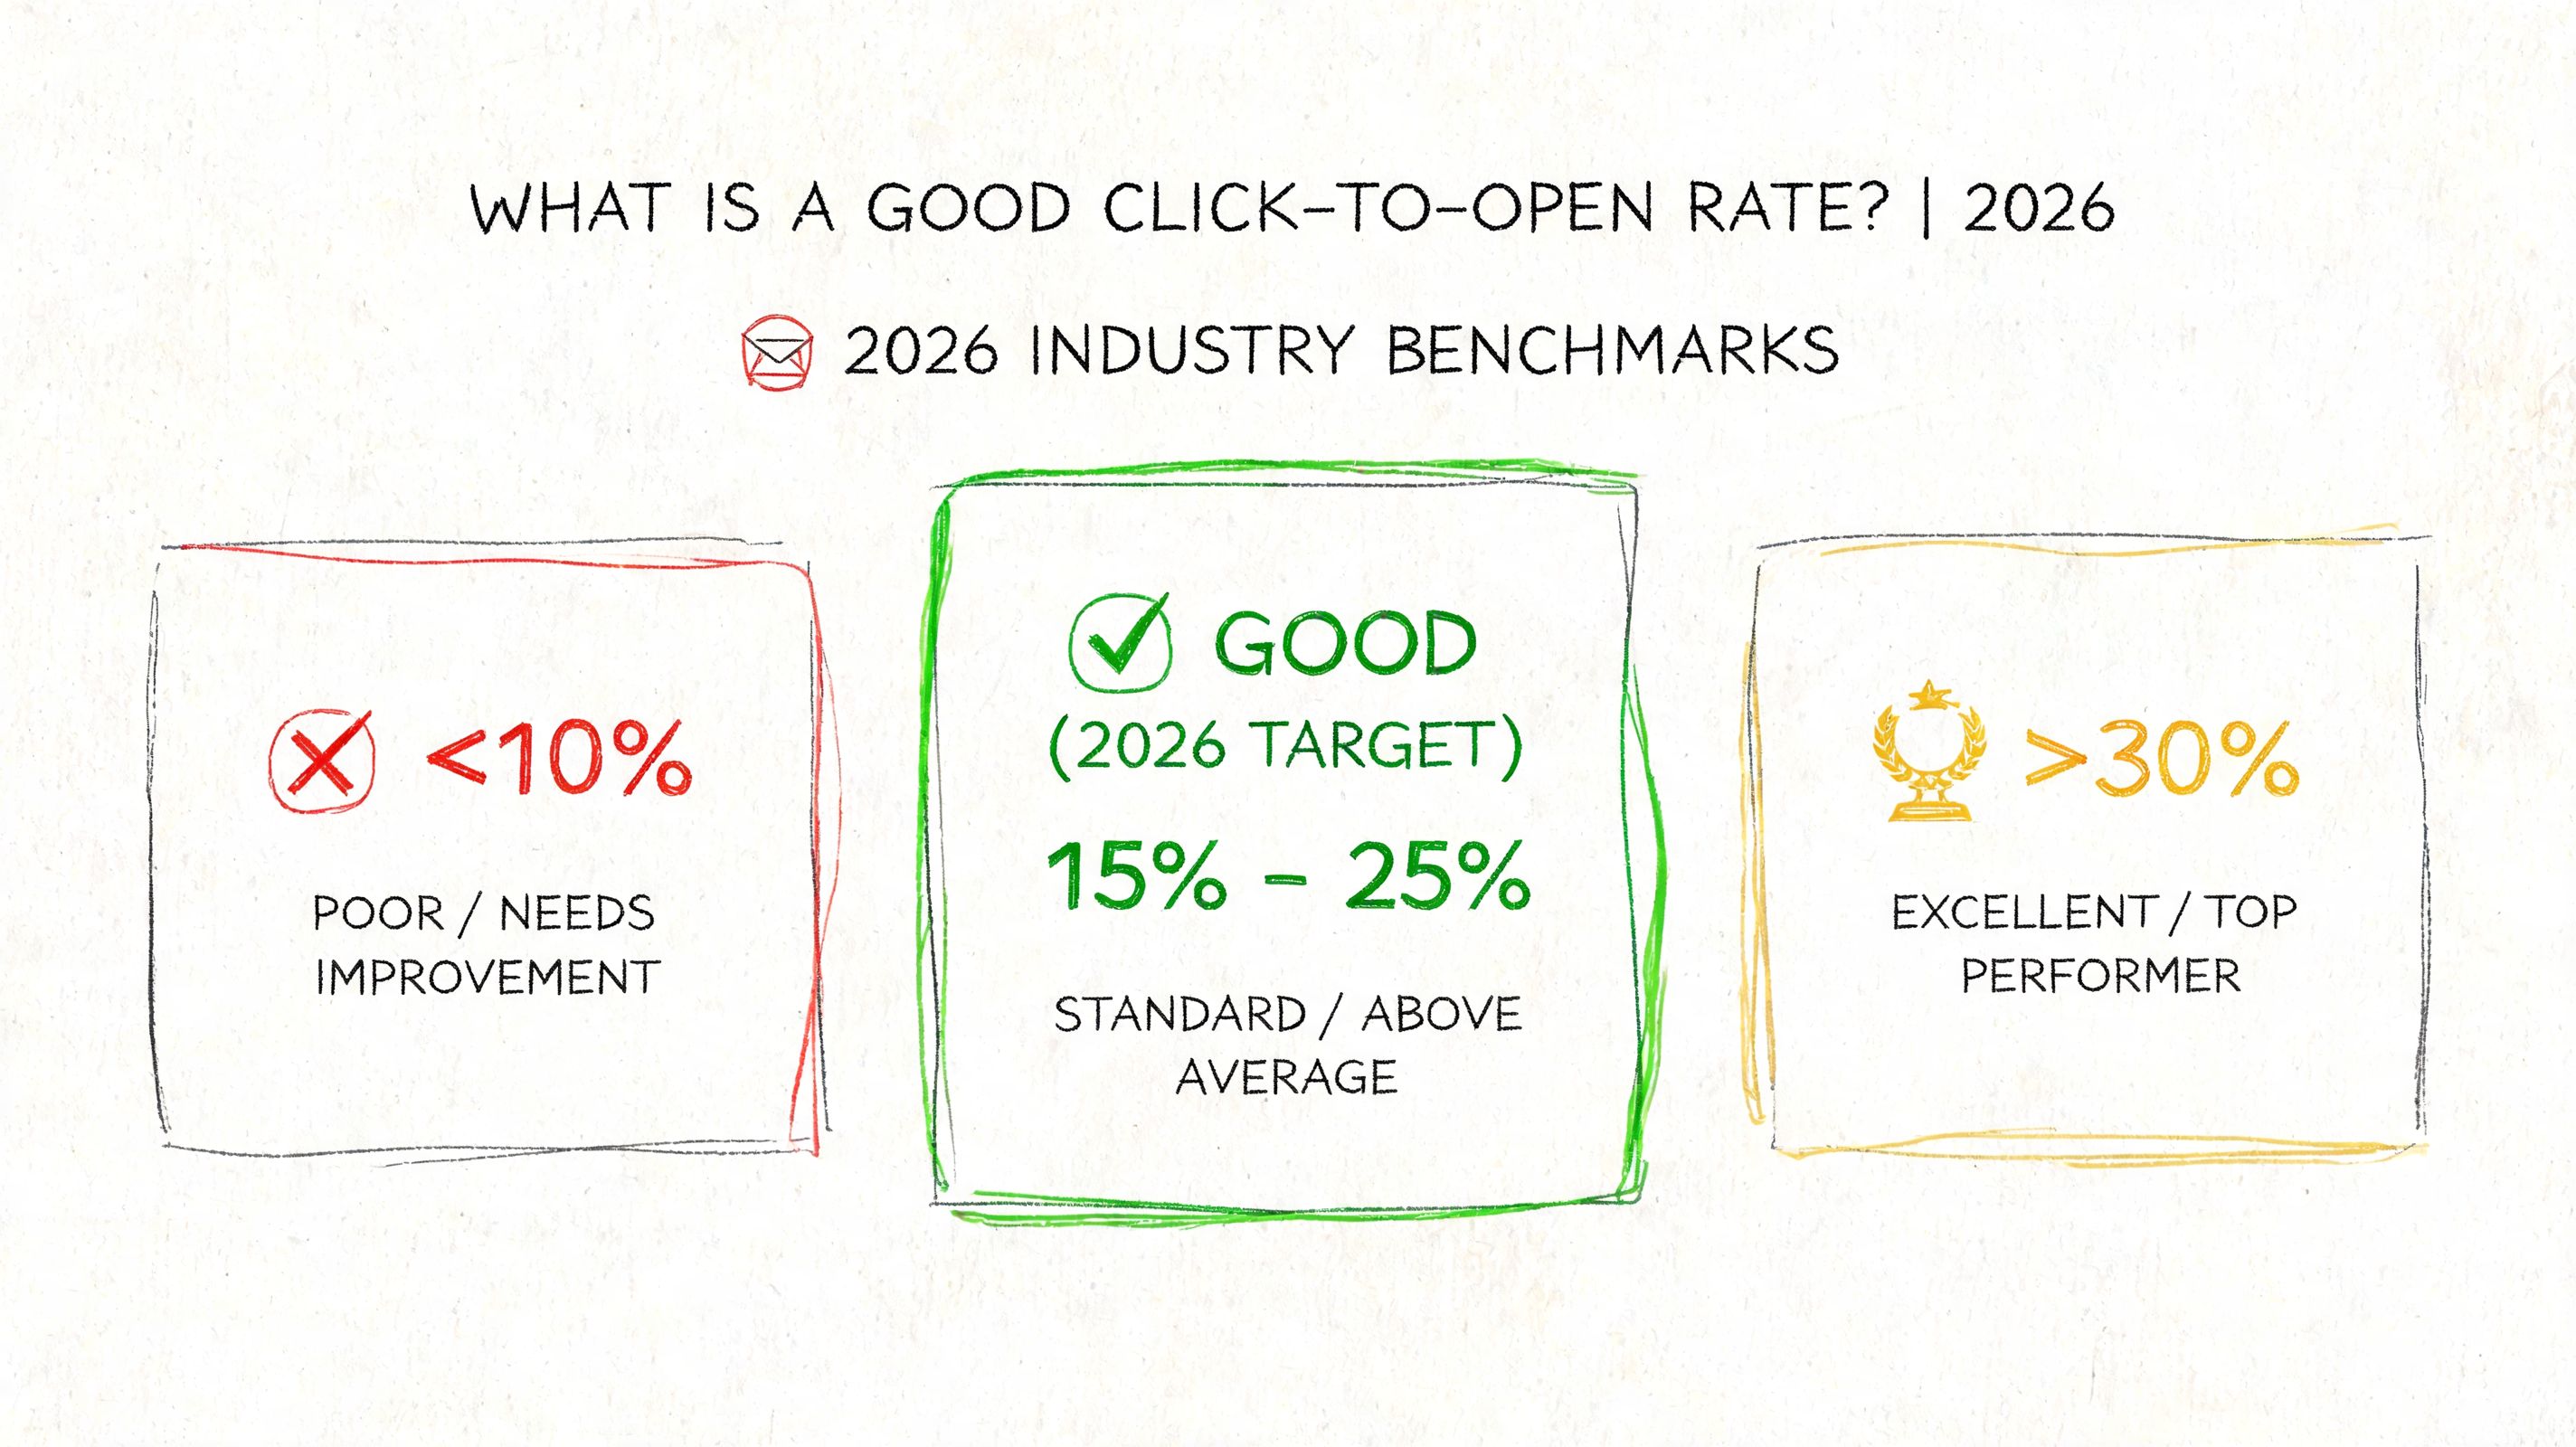
According to Prospeo’s summary of recent benchmark data, the all-industries median CTOR in 2026 stands at 6.81%, based on an analysis of 3.6 million campaigns, and that figure represents a 21% year-over-year increase from 5.63% in 2024. The same source notes that the metric is evolving because Mail Privacy Protection changes how opens are counted. You can review that benchmark context in Prospeo’s write-up on average click-to-open rate data.
Why the benchmark answer is incomplete
That median gives you context, but not a target you should blindly optimize toward.
Post-MPP, opens are noisier. Since CTOR depends on opens, the denominator is less stable than it used to be. That means a campaign can look weaker on CTOR not because the content got worse, but because the counted open pool got artificially inflated.
So yes, external benchmarks are still useful for orientation. They’re just no longer reliable enough to run your program by themselves.
The benchmark that matters more
Your best benchmark is your own recent history.
If you send regularly, compare each campaign against a rolling baseline from your own list, your own segments, and your own sending patterns. That’s far more actionable than chasing someone else’s median. A DTC newsletter, an abandoned cart flow, a founder update, and a win-back campaign shouldn’t be judged by one blended external number.
This gets even more important when you’re looking at recurring sends such as a newsletter email program. Repetition gives you trend lines, and trend lines are where CTOR becomes useful.
A better way to answer “is my CTOR good?”
Ask these questions instead:
- Is this campaign above or below my recent baseline?
- Did CTOR improve when I changed the offer, layout, or CTA?
- Do automated emails consistently outperform broadcasts for my audience?
- Is CTOR holding steady while click rate or conversions fall?
Those questions produce decisions. Generic benchmark chasing usually produces confusion.
If your CTOR is improving against your own recent baseline, that’s more meaningful than matching a public benchmark built from different audiences, tools, and tracking assumptions.
So what is a good click-to-open rate in 2026? Broadly, the published median gives you a rough market snapshot. Operationally, a good CTOR is one that beats your own historical pattern and does so alongside healthy clicks and downstream outcomes.
Common Pitfalls That Skew Your CTOR Data
Most CTOR mistakes don’t come from bad math. They come from bad interpretation.
The biggest trap is treating CTOR as a clean universal benchmark when the denominator has changed. Industry sources now explicitly warn that CTOR is unreliable as an absolute benchmark post-Apple MPP because the “opens” denominator is inflated, making historical benchmarks obsolete for campaign evaluation. The same guidance recommends that the most reliable approach is to baseline CTOR against your own 90-day historical data, as explained in Prospeo’s analysis of click-to-open rate reliability after Apple MPP.
Pitfall one: reading a low CTOR as proof of bad content
A low CTOR may reflect weak email content. It may also reflect inflated opens. Those are not the same problem.
If your team reacts to every soft CTOR by rewriting copy, redesigning templates, or changing offers, you can end up fixing the wrong layer. Sometimes the content is the issue. Sometimes the metric got noisier.
Pitfall two: blending everything together
A single blended CTOR hides too much.
You should separate at least these categories:
- Broadcast campaigns
- Automated lifecycle emails
- New subscribers
- Repeat customers
- Promotional sends
- Content-driven sends
Mix those together and the average stops helping. A weak broadcast can drag down the number while your automations remain healthy. Or a strong loyalty segment can make a broad campaign look better than it really was.
Pitfall three: ignoring deliverability signals
Sometimes CTOR looks like a content problem because that’s the most visible explanation. The deeper issue is deliverability.
If sender reputation slips, mailbox providers may place more of your mail outside the primary inbox or in spam. That changes who sees the email and who clicks. In that case, CTOR doesn’t just reflect copy quality. It reflects the quality of your access to the inbox.
Low CTOR can be a content problem, a measurement problem, or a deliverability problem. Don’t assume you know which one without checking the rest of the data.
Pitfall four: comparing unlike campaigns
Teams often compare one-off promos with triggered flows and treat the difference as creative performance. That’s a bad comparison. Triggered emails usually arrive closer to intent, while broad campaigns often interrupt.
Compare like with like. Judge newsletters against newsletters. Judge cart recovery against cart recovery. Judge founder announcements against the previous founder announcement. That’s how click to open rates become useful instead of misleading.
Actionable Strategies to Increase Your CTOR
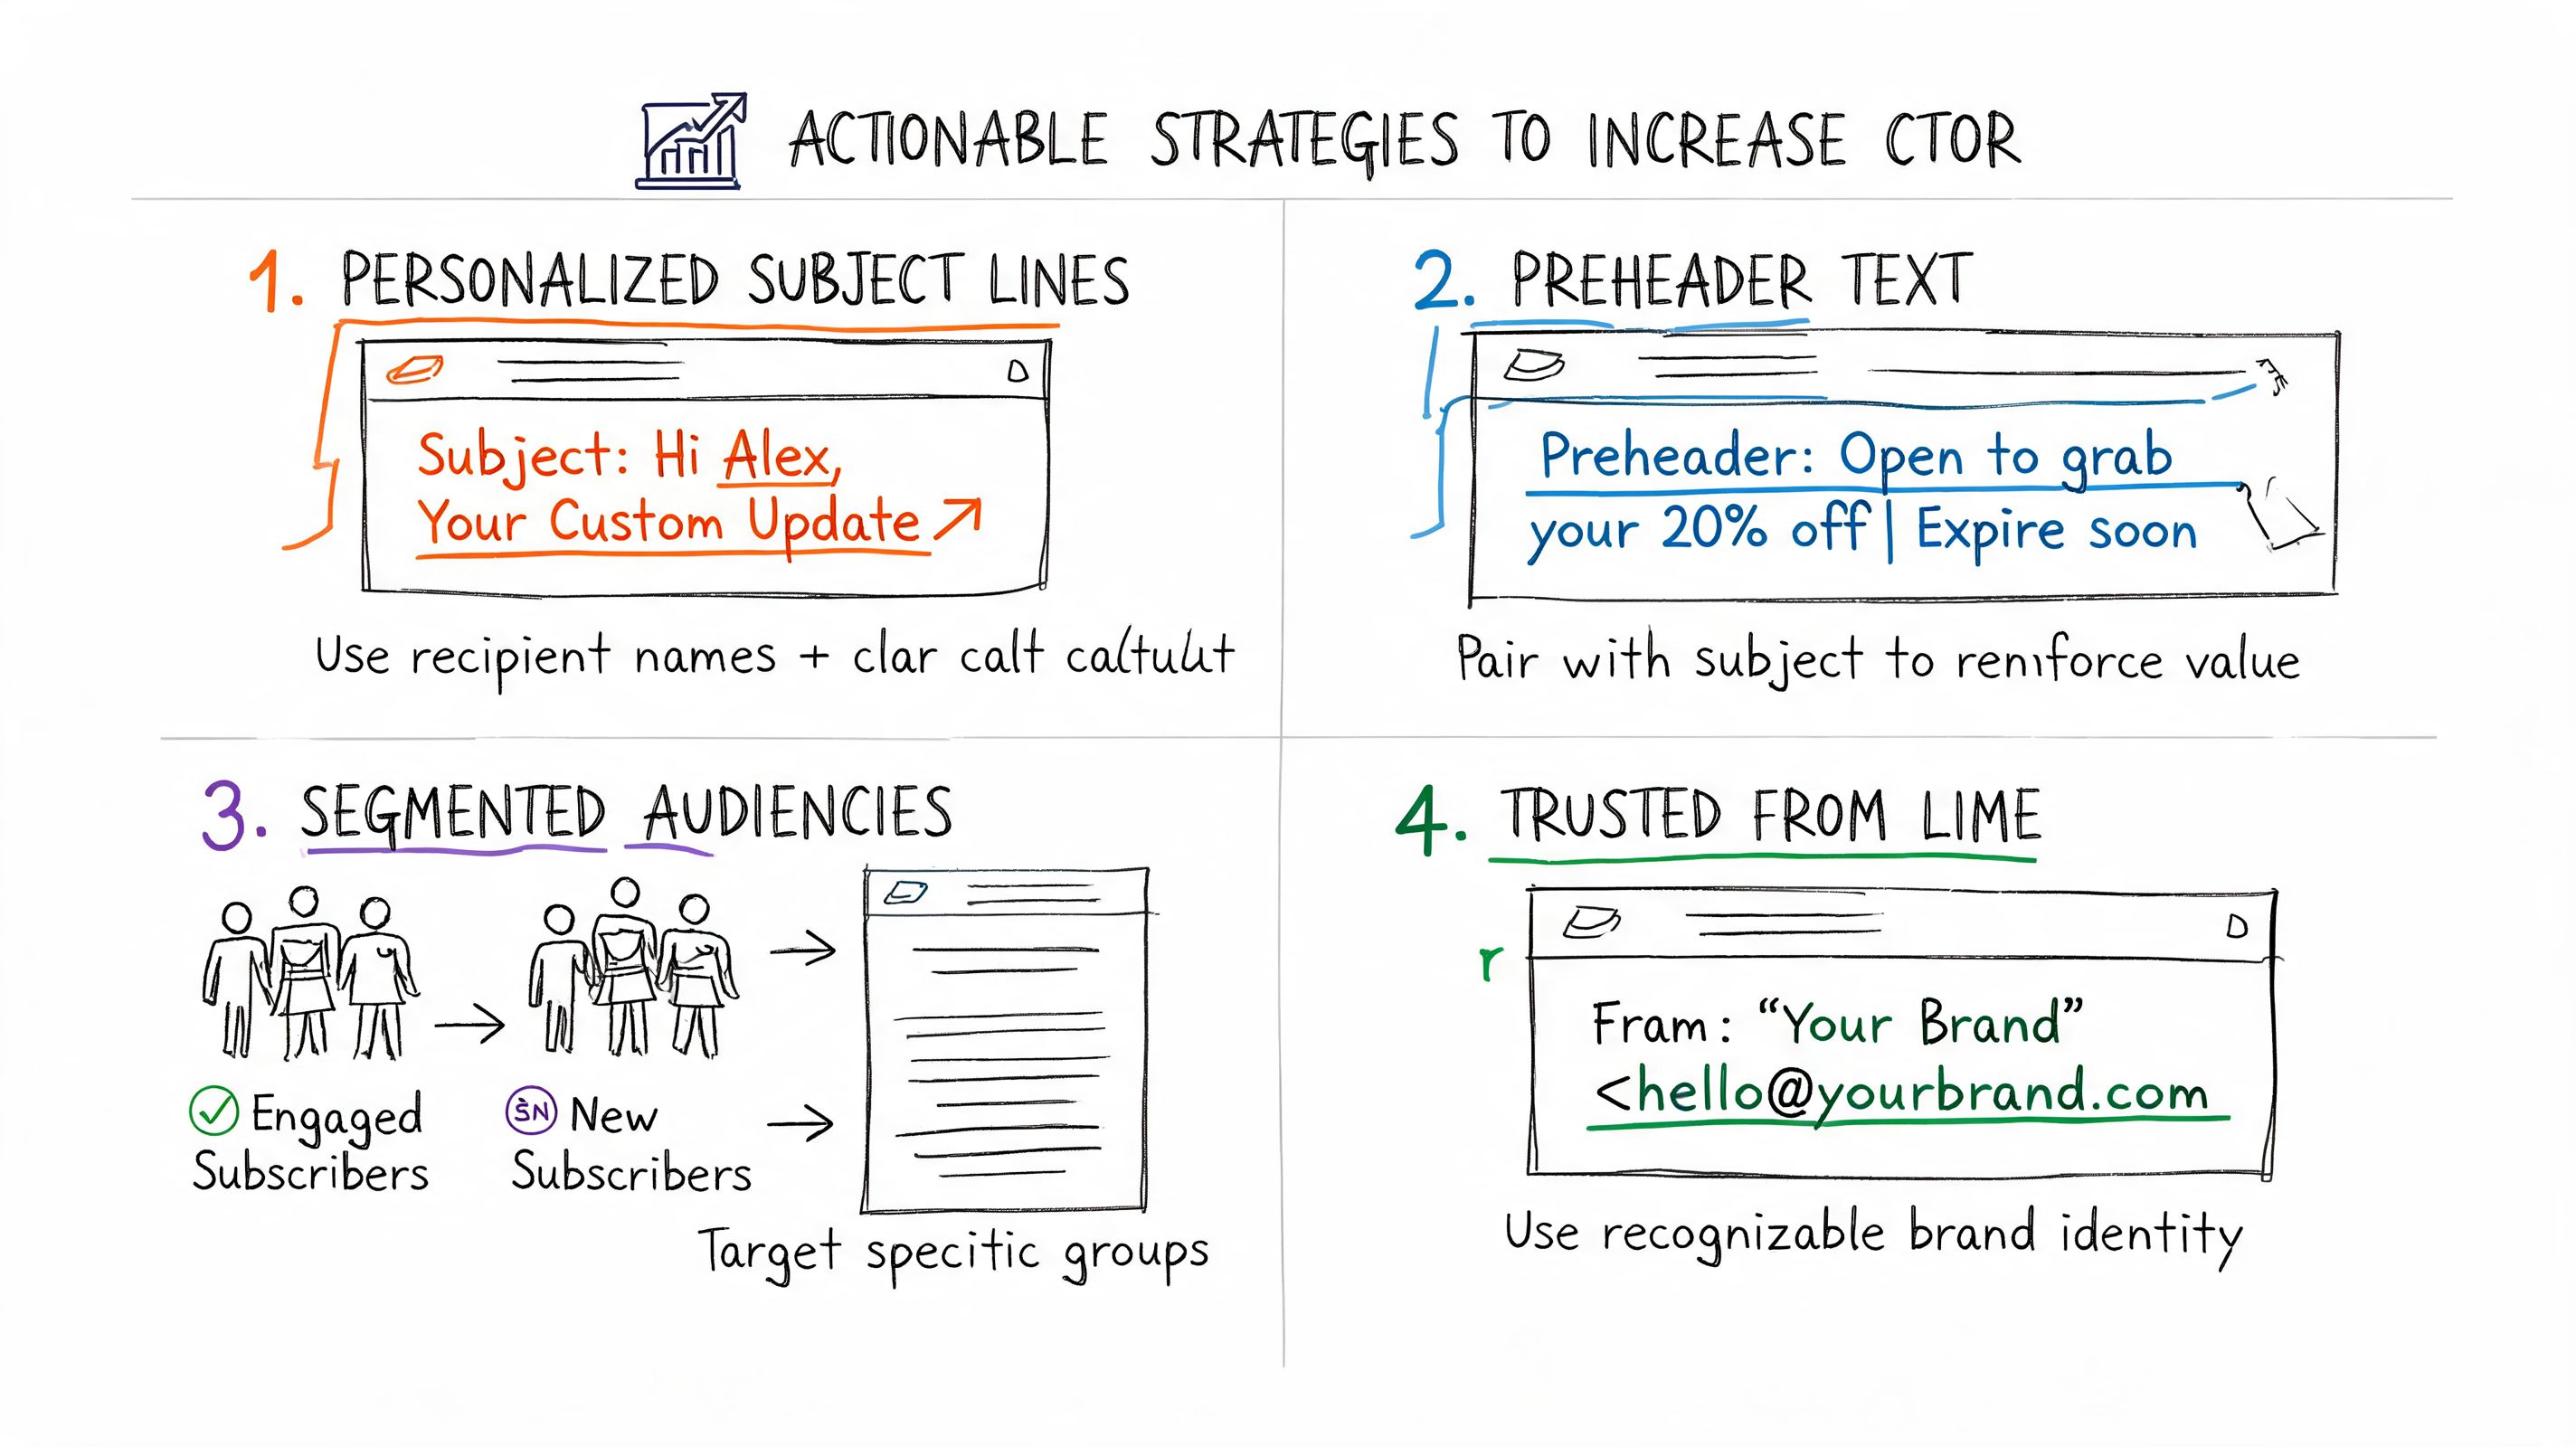
Improving CTOR starts with relevance. It doesn’t start with tricks.
The strongest gains usually come from making the message more aligned with the reason the subscriber opened in the first place. That means tighter copy, clearer structure, and stronger segmentation. It also means respecting the role of deliverability. If mailbox providers stop trusting your mail, engagement weakens even before you see the full damage in revenue.
MoEngage notes a direct relationship between engagement and deliverability: low engagement signals to mailbox providers that recipients don’t value your mail, which degrades your sender reputation. The same source reports that behavior-based emails achieve an average 25.5% CTOR versus 6.1% for broadcast emails, which is a strong reminder that relevance beats volume. That data appears in MoEngage’s overview of average email open rate and engagement benchmarks.
Tighten the message after the open
Most weak CTORs come from friction inside the email.
Try this checklist:
- Match the promise: If the subject line leads with a discount, update, launch, or lesson, the body should deliver that immediately.
- Reduce CTA sprawl: Too many links split attention. One primary action usually outperforms a crowded layout.
- Front-load value: Put the payoff near the top. Don’t force readers to scan through brand filler before they understand the benefit.
- Write for the skim: Short paragraphs, clear buttons, and obvious hierarchy make clicks easier.
Segment by intent, not just list attributes
A lot of founders segment by demographics and stop there. Behavior usually matters more.
Useful segments often include people who browsed but didn’t buy, customers who bought once, subscribers who clicked recent product emails, and readers who engage with educational content but ignore promotions. Those groups don’t need the same email.
If you want downstream sales to improve along with CTOR, the same principle shows up outside email too. Menza’s guide on how to improve ecommerce conversion rates reinforces the broader point: relevance and reduced friction are what move people forward.
Use behavior-based automation where it makes sense
Broadcasts still matter, but they’re often the least precise tool in the stack.
Behavior-based emails work because they meet a reader closer to an actual need. Cart reminders, browse follow-ups, onboarding nudges, trial education, and post-purchase messages usually have a clearer reason to exist than a generic campaign blast. That relevance shows up in CTOR because the message feels earned, not imposed.
Better CTOR usually comes from better timing and better fit, not clever wording alone.
Improve the pre-click experience
Founders often obsess over the link itself and ignore the setup around it.
A CTA gets clicked when three things are clear:
- What you’re offering
- Why it matters now
- What happens after the click
If any one of those is fuzzy, click intent drops. That’s why message architecture matters more than button color debates.
Test the part people actually react to
Subject lines matter, but CTOR improves when you test inside the message too.
Use a tool like a subject line tester when you’re working the top of the funnel, then evaluate whether the body fulfilled that promise. Test link placement, CTA phrasing, opening copy, image-to-text balance, and whether a plain-text style version gets cleaner engagement than a heavily designed template.
The goal isn’t a prettier email. It’s a clearer path to action.
Conclusion From Metric to Momentum
Click to open rates matter more now because open rates matter less than they used to. That’s the actual shift.
CTOR is not a perfect benchmark, and it shouldn’t be treated like one. Post-MPP, it works best as an internal signal. It helps you diagnose whether your message, offer, and CTA are strong enough to move readers who appear interested. Paired with click rate, conversion rate, and reply behavior, it gives you a sharper view of what’s happening.
The teams that use CTOR well don’t obsess over public averages. They track their own trend lines, segment aggressively, compare like with like, and watch for the interaction between engagement and deliverability. They know that a weak CTOR might mean weak copy, weak relevance, or weak inbox placement. The point is to find the underlying problem faster.
That mindset changes how you run email. You stop chasing flattering opens and start building campaigns that earn action. Over time, that’s what produces more resilient performance.
If you want that kind of control, Mailtani is built for it. You bring your own sending provider, keep ownership of your infrastructure and costs, and run email without shared-platform markup. For founders who care about real engagement, sender reputation, and cleaner analytics, that’s a much stronger foundation than renting someone else’s stack.