
Beyond Open Rate for Emails: True Engagement in 2026
Your open rate for emails is misleading you. Apple privacy broke this metric. Learn what a 'good' rate is in 2026 and how to truly track engagement.

Most advice about email performance still starts with the wrong question: “What’s a good open rate?”
That question used to be useful. Now it’s often a trap.
If you optimize for open rate for emails in isolation, you can end up rewarding the wrong campaigns, misreading deliverability problems, and congratulating yourself for activity that never turned into clicks, replies, or revenue. A high open rate can mean your subject line worked. It can also mean a privacy feature loaded your tracking pixel before a human saw anything. A low open rate can signal weak positioning. It can also come from blocked images, proxy servers, or mailbox behavior that your reporting can’t interpret cleanly.
Experienced email operators eventually learn the same lesson: open rate is a weak signal. It still has some value, but only as a rough diagnostic. It is not the KPI to build your strategy around.
The Trouble with Your Email Open Rate
Open rate looks simple. It feels intuitive. People opened the email, or they didn’t.
That simplicity is exactly why marketers overvalue it.
An open doesn’t prove attention. It doesn’t prove reading. It doesn’t prove interest. It definitely doesn’t prove business impact. If you run email for an ecommerce brand, a SaaS product, or a DTC store, you already know the painful version of this story: one campaign posts a strong open rate and barely moves sales, while another campaign gets fewer opens and drives the majority of the response.
Industry benchmarks reinforce how slippery the metric already was. In 2025, Retail & eCommerce averaged 18% to 25%, while SaaS & B2B Services averaged 22% to 28% according to LINK Mobility’s 2025 email open rate benchmarks. That alone tells you there was never a universal “good” number.
What open rate actually does well
Used carefully, open rate can still help with a few narrow jobs:
- Spotting abrupt drops that may point to inbox placement or reputation issues
- Comparing subject line angles in a rough way, especially within the same audience
- Checking onboarding flows where intent is naturally high and recipients expect the message
That’s it. It’s a directional check, not a scorecard for success.
Practical rule: If a campaign had a strong open rate but weak clicks, weak replies, and weak conversions, the open rate didn’t matter.
Where teams get misled
The biggest mistake is treating open rate like a destination instead of a symptom.
A campaign can earn curiosity with a sharp subject line and still fail the moment the body copy, offer, or call to action appears. Worse, teams sometimes chase opens with gimmicks, vague urgency, or misleading subject lines. That approach may lift the dashboard number, but it trains subscribers to distrust the sender. Once that trust fades, every future campaign gets harder.
The right mindset is skeptical. Keep open rate on the dashboard if you want. Just stop letting it drive the strategy.
How Email Open Rates Are Measured
Open tracking is built on a tiny technical trick.
Most email platforms insert a tracking pixel, usually a tiny invisible image, into the email. This acts as a digital tripwire. When the email client loads that image from the sender’s server, the platform records an “open.”

The basic mechanism
Here’s the normal flow:
- You send an email through a platform or provider.
- The email contains a hidden image tied to that recipient and campaign.
- The recipient’s email app loads the message and requests that image.
- The server receives the request and logs an open event.
That’s the whole system. No magic. No direct proof that someone read your copy. Just a remote image request that gets counted as engagement.
A lot of reporting dashboards make this process feel more exact than it is. It isn’t. If you’ve ever looked through email analytics reporting tools, you’ve seen how polished those charts can look. The underlying event is still just a pixel load.
Why some email types report much higher opens
This mechanism also explains why triggered emails often outperform broad newsletters. According to Pushwoosh email open rate benchmarks, automated and transactional emails achieve 50% to 60%+ open rates, with welcome series at 83.63% and shipping confirmations at 62.47%, while newsletters sit at 40.08%. The reason isn’t mysterious. These messages arrive when the recipient expects them and wants the information.
That timing matters more than most subject line debates.
What the metric is really measuring
Open rate for emails is supposed to measure one narrow thing: whether the hidden pixel got loaded after delivery.
That means it’s not measuring:
- whether the person read the email
- whether they understood the offer
- whether they trusted the sender
- whether they clicked, replied, or bought
An open is a server event, not a human verdict.
That distinction matters because many campaign reviews still treat opens like proof of audience interest. They’re not. They’re one technical event in a chain, and a fragile one at that.
Why You Can No Longer Trust Open Rate Data
The tracking pixel model was always imperfect. Then privacy protections made it much worse.
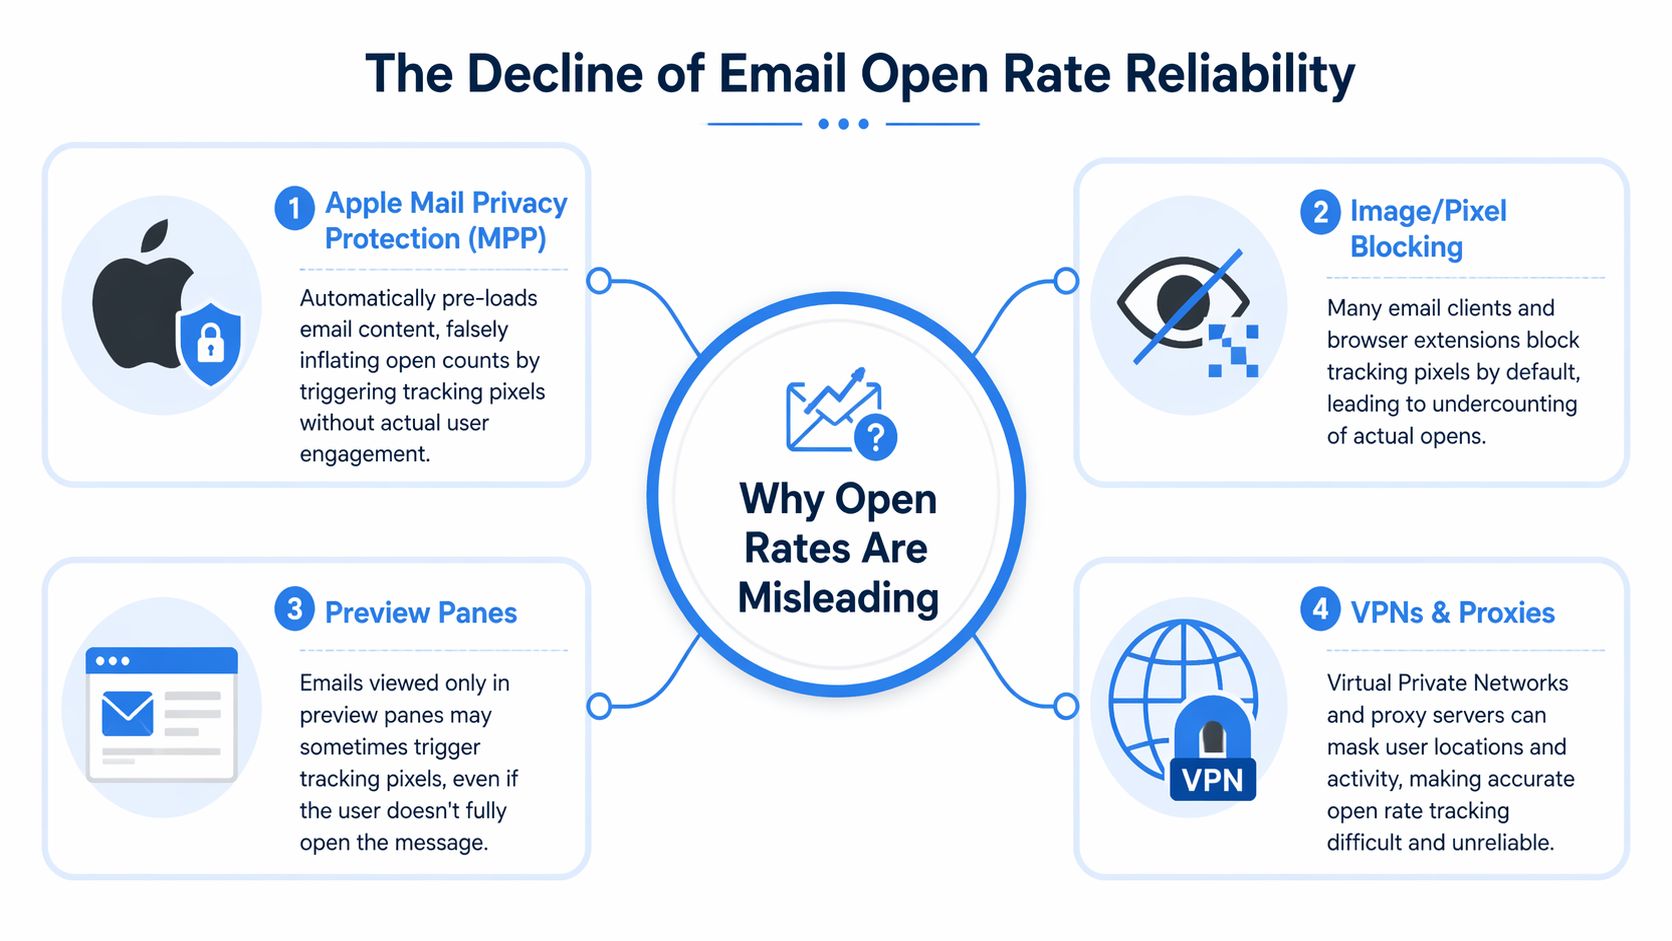
Apple changed the game by making email opens easier to fake at the system level. Its privacy features can load email content automatically, including the tracking pixel, whether or not the recipient engaged with the message. That turns a measurement problem into a reporting problem. Your dashboard says “open.” Your subscriber may never have looked at the email.
Apple MPP broke the old logic
The clearest summary comes from Meettie’s discussion of good email open rates, which notes that Apple’s iOS 15 privacy update inflated reported email open rates by 20% to 40% since 2021, making later benchmark numbers misleading for true engagement.
That matters because open tracking assumes image loading equals attention. Apple’s privacy model severs that connection.
If a large slice of your audience uses Apple Mail, your reported opens can rise without any real change in content quality, inbox placement, or subscriber intent. Teams that don’t account for that distortion often make bad decisions fast. They keep weak campaigns. They overestimate subject line performance. They miss early signs that the body content is underperforming.
Other systems distort opens too
Apple gets the attention, but it isn’t the only problem.
Open rate for emails can also be skewed by:
- Image blocking because some clients or settings prevent the pixel from loading
- Corporate filters that scan or proxy email content before a user sees it
- Preview panes that may trigger a load event without full engagement
- VPNs and proxies that obscure where and how requests originate
It’s useful to consider: open tracking can both overcount and undercount, sometimes in the same campaign.
That’s why list hygiene matters even when the open metric itself is messy. If you’re still sending to stale or low-quality contacts, the noise gets worse and your deliverability gets harder to diagnose. Cleaning dead weight from the audience is one of the few fixes that improves both measurement quality and sender health. A simple email list cleaner helps reduce that confusion before you even get to campaign analysis.
A short walkthrough makes the issue easier to see in practice:
What to trust instead
Don’t throw open rate away entirely. Demote it.
Use it as a rough warning light, not a performance goal. If opens collapse across multiple campaigns, investigate deliverability. If opens look healthy but clicks and replies are flat, assume the problem sits below the subject line.
Stop asking, “Did they open?” Start asking, “Did they do anything that required intent?”
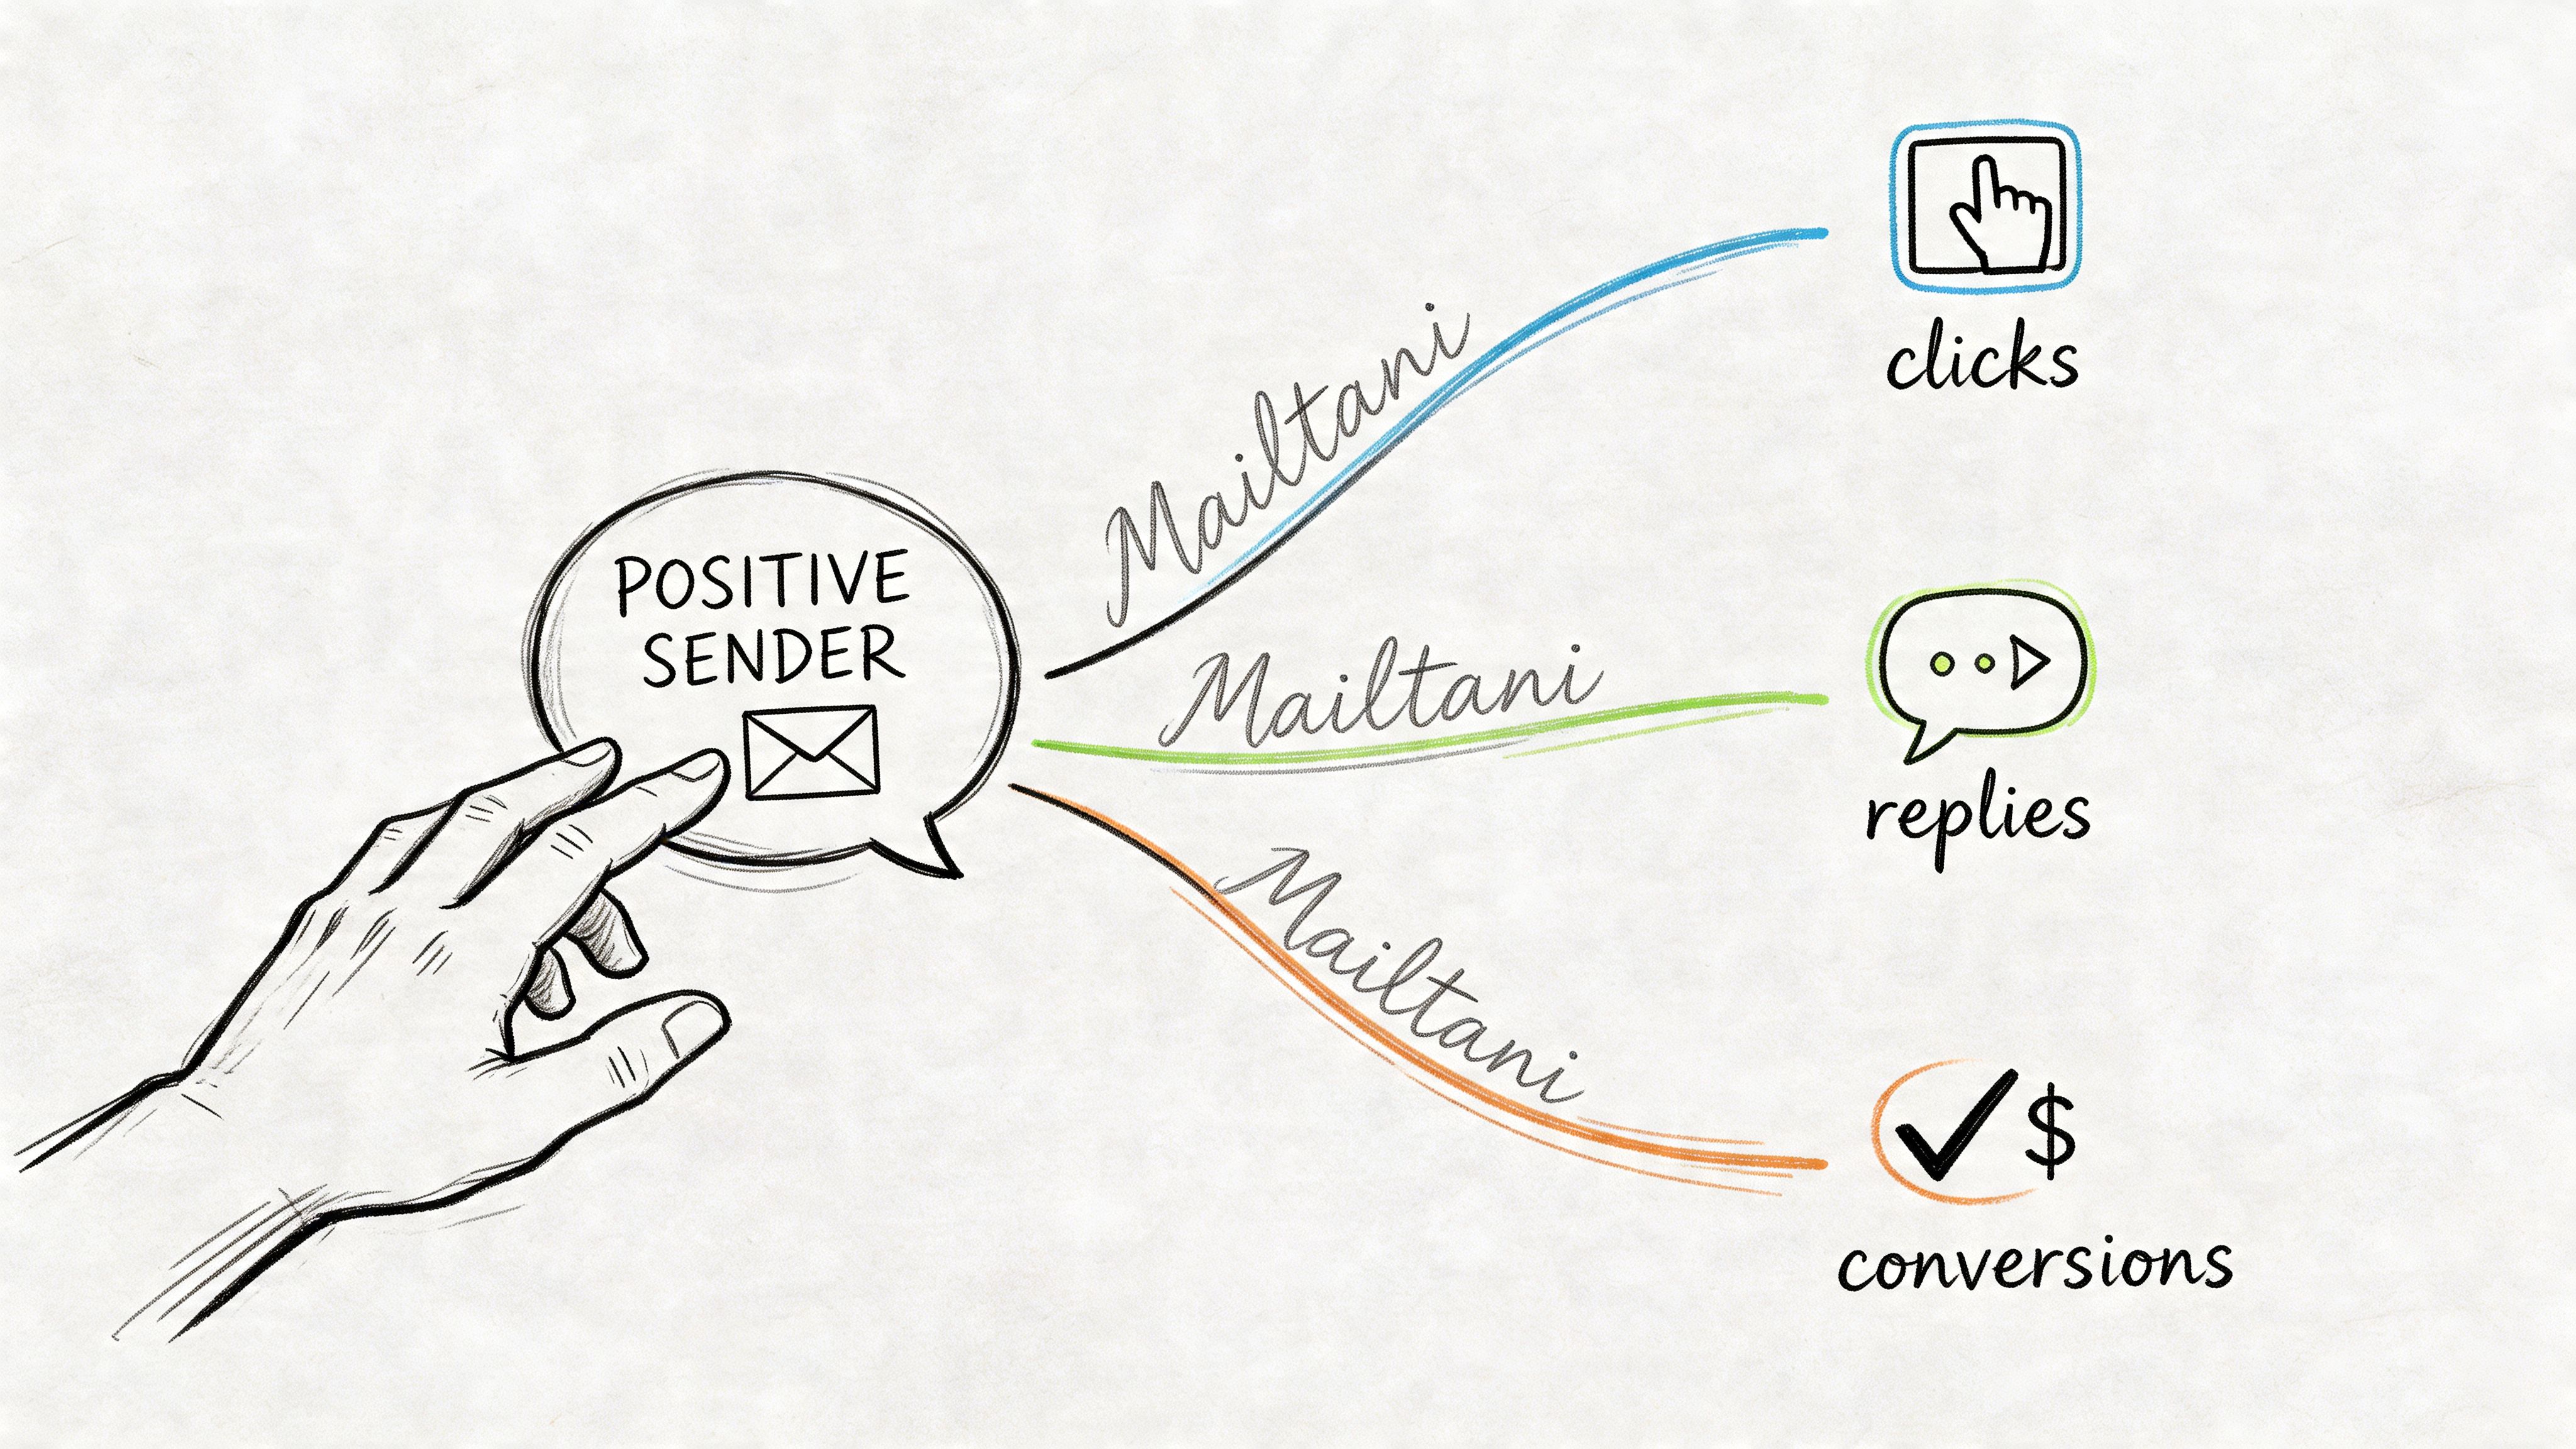
That means your primary engagement metrics should come from actions a machine is less likely to fake. Clicks. Replies. Conversions. Product usage after the email. Purchases after the email. Demo bookings after the email.
Those metrics may be lower, but they’re closer to truth.
Realistic Email Open Rate Benchmarks in 2026
Benchmarks still get attention for one reason. Teams want to know if they have a performance problem or a measurement problem.
That’s a fair question. It just gets dangerous when open rate turns into the score everyone chases.
In 2026, the only honest way to use an open-rate benchmark is as a loose operating range. It can help you spot whether a program looks unusually weak or unusually inflated for its category. It cannot confirm audience interest, message quality, or revenue impact, especially after years of privacy features and proxy loading distorted the metric.
Directional benchmark table
As noted earlier, industry benchmark studies still give a rough frame of reference for common sending categories.
| Industry | Average Open Rate Range |
|---|---|
| Retail & eCommerce | 18%–25% |
| SaaS & B2B Services | 22%–28% |
| Finance & Insurance | 25%–32% |
| Healthcare | 23%–30% |
| Travel & Hospitality | 20%–26% |
| Nonprofits | 27%–35% |
Use ranges like these carefully.
A nonprofit newsletter with strong mission affinity will often behave differently from a retail campaign pushing weekly offers. A SaaS lifecycle email sent after a product action will usually produce a different open pattern than a broad monthly update. The benchmark only becomes useful after you narrow the comparison to audience type, email purpose, and list quality.
How to use benchmarks without fooling yourself
The right question is not, “Is 28% good?” The right question is, “Good for what, and measured how?”
Open-rate benchmarks are still helpful in a few narrow cases:
- Track sudden movement over time within the same program
- Compare similar sends by segment, campaign type, and cadence
- Check for mismatch between reported opens and harder outcome metrics
That last point matters more than the benchmark itself. If reported opens stay high while clicks, replies, and conversions soften, the open number may be inflated, your targeting may be off, or both. If opens fall across many campaigns at the same time, inbox placement, domain reputation, or list fatigue deserves a closer look.
For a wider context, this roundup on the typical open rate for email marketing in 2026 is useful because it shows how widely “normal” can vary by business model and send type.
The benchmark I trust more
The pattern between open rate and intent signals tells you more than the open rate alone.
I trust an email program more when its clicks, replies, conversions, and downstream product actions move in a coherent direction. If opens rise but nothing else improves, that result is weak evidence at best. If opens look average while conversion efficiency improves, the program is getting healthier even if the vanity metric does not make a dashboard look impressive.
Treat open benchmarks as a rough calibration tool. Save your real judgment for actions that required a human to care.
Driving Real Engagement Beyond the Open
Once you stop worshipping opens, your email strategy gets clearer.
You stop asking how to make more people trip a tracking pixel. You start asking how to make the right people take an action that matters. That change improves copy, segmentation, and automation all at once because it forces relevance back into the system.
The metrics worth caring about
The strongest email programs usually review performance through a short stack of action-based signals:
- Click-through rate when the goal is traffic to an offer, product, or content asset
- Click-to-open rate when you want to judge whether the email body matched the subject line’s promise
- Reply rate when the message is conversational, sales-led, support-led, or founder-led
- Conversion outcome when the campaign exists to drive purchase, signup, booking, or activation
Each one has trade-offs. Click rate can look weak in plain-text emails that are designed to earn replies instead. CTOR depends on opens, so it isn’t immune to tracking distortion, but it still tells you more about message fit than open rate alone. Reply rate is powerful for intent, though it’s most useful in flows where a reply is a natural next step. Conversion is the final judge, but it often needs cleaner attribution and stronger instrumentation.
What actually improves meaningful engagement
The first lever is relevance. Broad campaigns can work, but generic campaigns rarely do. Teams running general email marketing programs can find practical structure in the email marketing use case overview.
Behavior-based personalization remains one of the clearest examples. MoEngage’s email benchmark analysis reports 37.04% open rates for behavior-based emails versus 26.9% for broadcasts, along with 25.5% click-to-open rates and 5.5% conversions for behavior-triggered campaigns. Those numbers matter less as bragging rights and more as evidence of a principle: send based on what people did, not what you hope they might care about.
Here’s what that looks like in practice:
- Recent product viewers get follow-up messages tied to the category they browsed
- Recent purchasers get post-purchase education, care tips, or related recommendations
- Trial users get prompts tied to setup steps they haven’t completed
- Inactive subscribers get re-engagement emails with a clear reason to return or opt out
The second lever is timing. Triggered email usually beats scheduled broadcast because it arrives close to intent. That’s why welcome flows, account confirmations, shipping updates, and cart-related messages outperform general sends so often. They answer an active need.
A welcome sequence is the clearest example. Oberlo’s email marketing statistics report welcome emails averaging 68.6% opens across industries. Even with all the caveats around opens, that result reflects something real about user psychology: people pay attention when the message immediately follows an action they just took.
A practical operating model
If I were rebuilding an email program from scratch, I’d structure measurement around three layers.
-
Delivery and reach Check whether emails are landing and whether basic engagement signals are stable. Open rate lives here, but only as a rough signal.
-
Intent Track clicks, replies, and downstream session behavior to learn whether the message created interest.
-
Outcome Measure purchases, bookings, retained usage, or some other business event. Here, the campaign earns its keep.
The healthiest email teams treat opens as the top of a funnel, not the verdict at the end of it.
What doesn’t work anymore
Some habits keep showing up because they make reports look better even when they weaken the channel:
- Clickbait subject lines that win the open and lose trust
- Batch-and-blast campaigns sent to everyone because segmentation feels slower
- Measuring success too early, before looking at replies or conversions
- Protecting list size instead of protecting list quality
The cleaner play is harder but more durable. Segment more aggressively. Trigger more messages from real behavior. Accept that your vanity metrics may fall while your useful metrics improve. That’s a trade worth making.
How Your Sender Reputation Controls Success
Strategy helps. Infrastructure decides whether strategy gets a fair chance.
If mailbox providers don’t trust your sending setup, your strongest subject line, cleanest segmentation, and best offer won’t matter much. Messages land in spam, get throttled, or disappear into low-attention tabs. Then teams stare at the dashboard and blame creative when the underlying issue is sender reputation.
Reputation is built by behavior
Mailbox providers look for patterns. They care whether recipients engage, ignore, delete, complain, or reply. They care whether your sending behavior is stable or erratic. They care whether you ramp volume responsibly or appear out of nowhere at full blast.
That’s why shared sending environments create hidden risk. If you’re on infrastructure used by many other senders, you inherit noise you didn’t create. One sender’s bad practices can affect trust in the pool you’re using. Even when your own campaign quality is solid, you may still pay the price in placement.
If you want a strong operational primer on the basics, this proven guide to inbox success is worth reading because it ties list quality, authentication, and sending discipline back to actual inbox outcomes.
Control changes what you can fix
Owning more of your sending stack gives you more direct control over the variables that shape reputation:
- Domain alignment keeps your identity consistent across sends
- Dedicated warmup lets you increase sending volume gradually instead of spiking
- Address rotation helps distribute activity more cleanly at scale
- Unified reply handling makes it easier to see which campaigns create real conversations
- Provider portability reduces the risk of getting trapped in one platform’s policies or shared environment
Warmup matters more than many teams realize, especially on fresh domains or newly active sending identities. If you suddenly push large volume without preparation, mailbox providers can treat that as suspicious. A structured email warmup process helps establish a steadier trust pattern before you rely on email for serious revenue work.
The deeper point
When marketers talk about improving open rate for emails, they often jump straight to subject lines and send times.
Those things matter. But they sit on top of the underlying foundation. If your infrastructure is unstable, your reporting is distorted, or your reputation is weak, optimization becomes guesswork. You’re testing copy inside a delivery problem.
Good email performance starts before the subject line. It starts with sender trust.
That’s the shift experienced operators eventually make. They stop chasing a prettier dashboard and start building a channel they can measure, trust, and improve. Once that happens, open rate goes back to its proper place: a secondary signal, useful sometimes, dangerous when overvalued.
Mailtani gives you that control without the usual platform markup. You connect your own sending provider, keep ownership of your infrastructure, warm up domains responsibly, track replies in one place, and build campaigns around real engagement instead of vanity metrics. Check the pricing page for the one-time cost model. If you want an email stack designed for deliverability, portability, and honest measurement, take a look at Mailtani.


